I know "Wonky", but what is cache?
According to TechTarget, a cache -- pronounced CASH -- is hardware or software that is used to store something, usually data, temporarily in a computing environment.
Does Paragon use cache?
Paragon and Paragon Connect, require a web browser such as Safari, Firefox, Chrome, or Edge, to operate. Technically, the browser uses caching to help Paragon, and other webpages you visit, run faster and operate more efficiently.
What are the common issues seen in Paragon due to corrupted cache?
Login issues or login errors
Loading and formatting issues
Fields not operating correctly
Slow screen behavior
Missing information
Searches or reports not rendering correctly
Same search repeating/reloading over and over
Cool! Now that I know what cache is, how do I get rid of the "Wonky" issues?
You can quick clear a specific website's cache! Before employing this method make sure you are currently on the Paragon or Paragon Connect website (even if it is showing you some kind of error, stay where the error is). Below is the method for Chrome on a desktop and mobile device:
On Desktop

Click the "site settings" button located just to the left of the address bar.

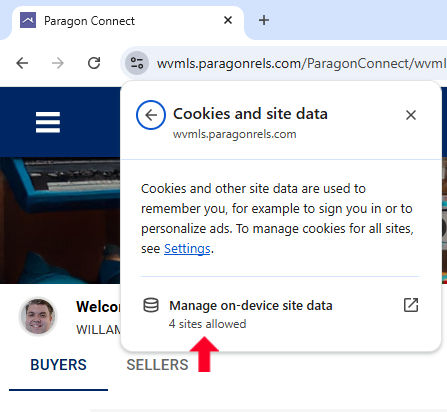
In the newly opened window click "Cookies and site data"

Click on "Manage on-device site data" in this section which will cause a pop-up window to appear.

In this window click all the trashcan icons and then the "Done" button to finish quick clearing the cache for just Paragon.
After this is complete if you hit refresh on your browser you should see the wonkiness is gone!
On Mobile

Tap the "Site Settings" icon to the left of the address bar.

Tap the "Cookies and site data" option in the newly opened window.

Tap the trashcan icon to clear the cache for just the Paragon Connect website.
Although the above guides only cover Chrome the placement and methods are very similar across all browsers. If you would like to clear your entire browser's cache follow the articles below for your relevant browser.
- Google Account Help
- Mozilla Firefox Support
- Microsoft Edge Support

A final word about cache
Usually, caches are helpful, and most of the time, you shouldn’t need to touch them. Periodically clearing your browser cache will help overcome the "Wonky" issues.


